Prioritizing Customer Service Actions at Scale
Although this case study is based on a real project, all data and variables have been simulated to ensure confidentiality
A major retailer struggled with poor customer service ratings. However, with millions of complaints spanning 8+ markets, 5 channels, and 20+ contact reasons, identifying high-impact interventions was complex. We delivered a prioritized roadmap of solutions, ranked by the projected reduction in customer dissatisfaction. This strategy drove up to a 75-point NPS increase in the affected areas.
BEFORE
Action Paralysis
Difficulty prioritizing customer complaints distributed across markets, contact channels, and contact reasons.

AFTER
Prioritization Roadmap
A list of problems ordered by the expected impact of their solutions in reducing unsatisfied customers (detractors)

Project Overview
-
Duration: 6 weeks.
-
Role: Eduardo González was the UX researcher leading the project.
-
Team: Cross-functional team including Designers, Researchers, and Product Owners.
-
Key Tools: R (data analysis & modeling) and Qualtrics (data consultation)..
-
Full Analysis and Code: Available on RPubs (contextual factor and the opportunity analysis).
-
Main Research Question: What are the most critical actions to improve customer service satisfaction?
-
Methods: Internal survey analysis (using NPS as the satisfaction metric) and thematic analysis of customer comments.
Narrowing Down the Areas to Intervene
The primary challenge was identifying the most relevant pain points within a complex landscape of over 800 potential areas (defined by the intersection of markets, channels, and contact reasons).
To efficiently narrow the scope, we first deployed heatmaps to visually isolate the interactions driving the lowest satisfaction scores. This allowed us to later conduct more rigorous statistical models, evaluating satisfaction across the main factors and specifically the interactions identified as relevant.
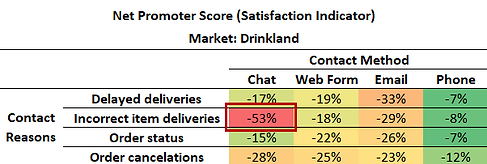
Note. Heatmaps helped identify relevant interactions (e.g., low satisfaction with Delivery issues only for Chat cases)
Defining the Unified Prioritization Metric

Note. Preliminary roadmap identifying areas for further study, based on the estimated percentage of unsatisfied customers.
To report results with relevance at scale, we needed a metric that accounted not only for satisfaction scores, but also for the associated volume of contacts: a low satisfaction score for a rare issue is less critical than the same score for a high-volume issue.
To create this unified measure of real impact, we translated all results into the Estimated Percentage of Additional Detractors (unsatisfied customers), using bootstrapping techniques to assess uncertainty. This approach effectively combined the predicted satisfaction score with case volume. As shown in the image, we initially used it to identify areas linked to higher potential Return on Investment (ROI)—that is, the areas with the most room for improvement in satisfaction.
Using Qualitative Data to Find Real Opportunities
Once high-impact areas were identified, we needed to translate them into tangible opportunities by analyzing the customer complaints within these areas. Given the sheer volume of data, we utilized representative sampling for thematic analysis. The coding of open responses allowed us to deliver a roadmap, ranking solutions by the estimated percentage of total unsatisfied customers reduced.

Note. Bootstrapping estimated the reduction in detractors and 95% confidence intervals for each issue.
Impact Evaluation

Satisfaction Uplift
The implemented solutions drove a Net Promoter Score (NPS) increase of up to 75 points in the affected areas

Strategic Impact
The findings informed key decisions across 4 executive strategic planning meetings.


